Homework 2
Instructions
The first part of this page explains how homework assignments will be handled and evaluated, since they are completed in groups. The questions for Homework 2 start further down, click this link to skip to that part of the page.
Overview
As a group, solve the homework problems and write your answers in the R Markdown file [homework_2.Rmd]{.monospace}. Grades for the group submissions will, in addition to correctness, be based on document formatting, visualization quality, writing quality, and code style. This means that your group submission is to be written in the style of a exploratory data report, meaning:
-
Each exercise must be written up using full sentences such that it is clear what question is being answered.
-
There needs to be plain text above each code block explaining what you are doing, and the code blocks should be organized.
-
The R Markdown file must knit without error and generate a PDF file, and the final PDF output must look nice, clean, and be easy to read.
Participation
Credit for group participation will be determined using the following sources:
-
A [CONTRIBUTIONS.md]{.monospace} file distributed with your group repository
-
Commit history on GitHub
-
Discussion history in your group’s private Slack channel
Each group will need to fill out the [CONTRIBUTIONS.md]{.monospace} file as part of their submission. This file is where where each group member lists what he or she contributed to the final submission. Read the section Fill out the [CONTRIBUTIONS.md]{.monospace} file for more details on how this works.
Google Docs
If your group used an external document to coordinate and organize your work, such as a Google Doc, then that can also count as evidence of participation, provided that there is a visible writing history and it is possible to identify which student is responsible for each edit. This will require you to share the relevant file with the instructor with full privileges on the document so that it’s possible to review the document’s editing history. Please note that anonymous edits to Google Docs documents cannot be used as participation evidence, since there is no way to verify the account responsible for the added content. Also, for similar reasons, offline documents traded back and forth via email cannot be accepted as evidence of participation.
How to answer the questions as a group
The following is a checklist you may follow to help you get started with answering the questions as a group:
::: {.no-bullets} * Read through all the problems individually. Then, as a group, discuss what will be needed to fully answer each question.
-
As a group, decide how you will split up writing responsibilities. A typical way to do this is to have each group member be responsible for writing out the full answer to a certain number of questions.
-
(Important) Before you start, make a copy of [homework_2.Rmd]{.monospace} and rename the copied file to include your last name. For example, if your last name is Smith, then your file copy should be renamed to [homework_2_smith.Rmd]{.monospace}.
-
Commit and push your copied file to GitHub.
-
Draft your contributions in your file. For example, if my last name was Smith and I agreed to write-up the answers to questions 4, 5, and 6, then I would open up [homework_2_smith.Rmd]{.monospace} and put my answers there. When I’m done, I would save my file, then commit and push my work to GitHub. :::
How to edit and merge your answers into the group submission
While you will be writing your answers in separate files, eventually the group will need to merge in everyone’s answers into the main [homework_2.Rmd]{.monospace} document. The following checklist may help with this:
-
Select an editor to be in charge of merging everyone’s answers into the final document [homework_2.Rmd]{.monospace}. Because the editor needs to prepare the document for submission, it is reasonable if he or she contributes slightly less in terms of answering the questions (for example, if everyone else answers three questions, it would be okay if the editor answers two).
-
The editor should ensure that everyone has committed and pushed their answers to GitHub so they can copy and paste in each contribution.
-
The editor needs to make sure that the final submission reads like a coherent document and that the writing style and code style are uniform across all the answers. In other words, it should read like a single person answered all the questions, not a group of four people.
-
The editor will be in charge of of committing and pushing the final R Markdown file to GitHub, knitting to PDF, and uploading the PDF file on Blackboard.
Fill out the [CONTRIBUTIONS.md]{.monospace} file
After everything is written up and ready for submission, the last thing the group will need to do is fill out the [CONTRIBUTIONS.md]{.monospace} file. By default, the file looks like this:
# Contributions to group submission

## Editor: FirstName LastName Member 1

*   Questions answered:

## FirstName LastName Member 2

*   Questions answered:

## FirstName LastName Member 3

*   Questions answered:

## FirstName LastName Member 4

*   Questions answered:
At a minimum, you must remove the [FirstName LastName Member]{.monospace} entries in the template and fill in the names of the people in your group, indicate which group member served as the editor, and state which questions were written up by each member.
Additional information beyond this should be supplied, such as indicating when a group member helped another group member edit an answer or gave helpful comments in a Slack discussion. For example, one group member’s contribution list may read as follows:
## Jane Smith

*   Questions answered: 4, 5, 6
*   Helped with editing on answers 8 and 9
*   Collaborated with group member Jack Williams on answering question 10
*   Pointed out spelling errors and suggested fixes to the document layout in the merged group document
Working with a GitHub repository as a group
You will likely encounter some issues while working in a group-based GitHub repository. In particular, you might find that when you click “Push” in the Git tab of RStudio, that it doesn’t seem to work and instead you get an annoying error message! This will happen when another member of your group has uploaded work before you did. While this can be irritating to deal with, this is actually a good thing, as it is GitHub’s way of protecting your files from accidential overwrites and deletions.
So what should you do to keep things running smoothly? First, always work in your own file, never in another person’s file. If you are not the editor, then you should not edit [homework_2.Rmd]{.monospace} either! Also, do not remove or rename any files that are not your own. Finally, when you are getting ready to work, following the procedure below should help keep the error messages to a minimum:
-
When you start working, you should begin by going to the Git tab and clicking “Pull” (notice this is not the same as “Push”). This will synchronize any new changes that your group may have made into your files.
-
Work on your file as normal. When you have completed your work, save your file.
-
Now we want to commit. But first, go to the Git tab and click “Pull” one more time to check for any other changes. Then, still in the Git tab, click the checkmark next to your updated file, type a message in the messagebox, and click the Commit button.
-
If the updated file is no longer in the list of files in the Git tab, then your commit was successful.
-
Click “Push” to upload your changed file.
If the above advice doesn’t work…
If, even after following the advice below, you still encounter error messages when Pulling from and Pushing to GitHub, contact the course instructor for help.
How to submit
The editor should follow the steps below to submit the homework for his/her group.
-
Make sure that everyone has committed and pushed their R Markdown files so that everything is synchronized to GitHub. If you do this right, then you will be able to view all the completed files on the GitHub website.
-
Knit your group’s R Markdown document to the PDF format, export (download) the PDF file from RStudio Server, and then upload it to Homework 2 posting on Blackboard.
The Titanic dataset
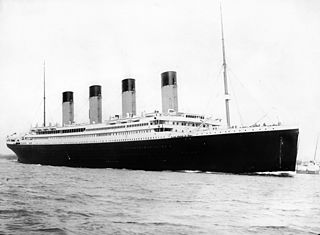
For this homework assignment, you will be exploring a dataset about the passengers on the Titanic, the British passenger liner that crashed into an iceberg during its maiden voyage and sank early in the morning on April 15, 1912. The tragedy stands out as one of the deadliest commercial maritime disasters during peacetime in history. More than half of the passengers and crew died, due in large part to poor safety standards, such as not having enough lifeboats or not ensuring all lifeboats were filled to capacity during evacuation.
This dataset presents the most up-to-date knowledge about the passengers that were on the Titanic, including whether or not they survived. This dataset is frequently used to introduce using machine learning techniques that take multiple inputs and use them to predict an outcome, in this case whether a passenger is likely to have survived. While we won’t be using a machine learning model in this assignment, there is still a lot of information that can be learned by exploring the dataset using the [tidyverse]{.monospace} suite.
The dataset contains the following variables:1
| Variable | Description |
|---|---|
| [pclass] | Passenger Class (1 = 1st; 2 = 2nd; 3 = 3rd) |
| [survival] | Survival (0 = No; 1 = Yes) |
| [name] | Name |
| [sex] | Sex |
| [age] | Age |
| [sibsp] | Number of Siblings/Spouses Aboard |
| [parch] | Number of Parents/Children Aboard |
| [ticket] | Ticket Number |
| [fare] | Passenger Fare (British pound) |
| [cabin] | Cabin |
| [embarked] | Port of Embarkation (C = Cherbourg; Q = Queenstown; S = Southampton) |
| [boat] | Lifeboat |
| [body] | Body Identification Number |
| [home.dest] | Home/Destination |
Also note that the following definitions were used for [sibsp]{.monospace} and [parch]{.monospace}:
| Label | Definition |
|---|---|
| Sibling | Brother, Sister, Stepbrother, or Stepsister of Passenger Aboard Titanic |
| Spouse | Husband or Wife of Passenger Aboard Titanic (Mistresses and Fiances Ignored) |
| Parent | Mother or Father of Passenger Aboard Titanic |
| Child | Son, Daughter, Stepson, or Stepdaughter of Passenger Aboard Titanic |
Questions
@.
Reading in the dataset using read_csv(file = "titanic_dataset.csv") causes some of the columns to be converted into inconvenient data types.
Fix this so that your later analysis does not run into problems.
Use the col_types = cols() argument within read_csv() as explained in this section of R for Data Science, http://r4ds.had.co.nz/data-import.html#problems, to change the data type defaults for the following columns:
*   Convert [survived]{.monospace} to the logical data type

*   Convert [pclass]{.monospace} to the character data type

*   Convert [sibsp]{.monospace} to the character data type

*   Convert [parch]{.monospace} to the character data type

After you get the inputs to `read_csv()` to work correctly, assign the dataset to a variable called [titanic]{.monospace}.

::: {.callout .secondary}
[Important!]{.h4}

You should **not** try to load the dataset by clicking the file [titanic\_dataset.csv]{.monospace} in the *File Explorer* panel or by using *File → Import Dataset*.
As an example,

```r
titanic <- read_csv(file = "titanic_dataset.csv")
```

would read the datafile and assign the loaded dataset to a variable called [titanic]{.monospace}.
:::
@. Compute how many known passengers were on the Titanic. Do not just print the table, use a function to count the passengers.
@. A famous directive for evacuating the Titanic was “women and children first”. Use your [dplyr]{.monospace} functions to verify the first part of this statement by counting the number of men and women that survived and that died. Then, using those counts, calculate the fraction of women that survived, \[\dfrac{\text{Number of female survivors}}{\text{Total number of female passengers}}\] and the fraction of men that survived, \[\dfrac{\text{Number of male survivors}}{\text{Total number of male passengers}}\] Do your computations support the idea that women were more likely to survive? Why or why not?
@. Verify the second part of the “women and children first” directive. This will not be as straightforward as it was in the previous question, as the dataset only contains people’s ages, which can take on many values. By default, there are no columns with labels of child or adult, so you will need to create your own.
Create a new column named [child_or_adult]{.monospace} that uses the age data to label each passenger.
For our purposes, we want to label anyone aged 0 -- 9 as a child and anyone age 10 and up are as adults.
If the age cell is blank ([NA]{.monospace}) for a passenger, also label them as an "adult".
Assign this updated dataset to the variable [titanic_age_groups]{.monospace}.

::: {.callout .primary}
[Hint]{.h4}

You will need to use the `if_else()` function to complete this task. An example usage of `if_else()` is the following:

``` r
titanic %>%
  mutate(
    cheap_or_expensive = if_else(
      condition = fare < 15,
      true = "cheap ticket",
      false = "not cheap",
      missing = "price unknown"
    )
  )
```

The input [missing]{.monospace} can be used to handle blank entries. In the above example, [NA]{.monospace} will be replaced with the text ["price unknown"]{.monospace}.
:::
@. Using the [titanic_age_groups]{.monospace} dataset you created in the previous question, count the number of children that survived and the number that did not. Do your computations support the idea that children were also more likely to survive? Why or why not?
@ques-predictor. A passenger’s age group and sex are not the only predictors of survival. For example, social standing and wealth can play a factor in survival. One of the parameters within this dataset acts as a proxy for distinguishing between the upper and lower classes. Which parameter is it? How do you know?
::: {.callout .primary}
[Hint]{.h4}

Answering this question does not require you to write any code.
If you do not know much about the *Titanic*, you may need to look up information to answer this question.
:::
@.
Group your dataset by [sex]{.monospace} and the variable you determined in question @ques-predictor and count the number that survived and the number that did not.
Create a bar chart that summarizes the data, where [survived]{.monospace} is along the horizontal axis and the passenger counts are along the vertical axis.
Use the bar chart fill = aesthetic to break the bar charts down by your variable from question @ques-predictor.
Additionally, facet over the [sex]{.monospace} variable.
Interpret this visualization and describe any survival patterns that you notice.
@. Create two visualizations:
*   The first visualization should be a bar chart displaying the fraction of the passengers that survived for different values of [parch]{.monospace},
    \\[\dfrac{\text{For a given parch, the number of survivors}}{\text{Total number of passengers}}.\\]
    Doing this requires grouping your data properly, counting the number of passengers in each grouping, and then dividing this by the total number of passengers on the ship.

*   The second visualization should be a bar chart displaying the fraction of the passengers that survived for different values of [sibsp]{.monospace},
    \\[\dfrac{\text{For a given sibsp, the number of survivors}}{\text{Total number of passengers}}.\\]
    Like above, doing this requires grouping your data properly, counting the number of passengers in each grouping, and then dividing this by the total number of passengers on the ship.

Interpret the patterns that you see in the visualizations.
@. Based on your analysis, write a list of the factors that affected the chances of survival for each passenger. You should be able to identify 4 different attributes that had a noticeable impact on survival. Justify each attribute that you list by referencing back to a table or visualization you created in a previous question.
Cheatsheets
You are encouraged to review and keep the following cheatsheets handy while working on this assignment:
-
http://biostat.mc.vanderbilt.edu/wiki/pub/Main/DataSets/titanic.html ↩